The Economics of One More Jet
Published on October 23, 2025 • 4 min read
What's one more jet worth to your FBO?
Not in some abstract capacity planning sense—what does it actually generate in revenue? Let's break down the real numbers.
Revenue Per Visit: Mid-Size Jet
Here's what a typical mid-size business jet generates on a single overnight visit:
| Revenue Category | Service Details | Revenue |
|---|---|---|
| Fuel | 300 gal @ $5.50/gal margin | $1,650 |
| Ramp Fees | Overnight parking + handling | $250-400 |
| Auxiliary Services | Lav ($50) + Water ($25) + GPU ($75) + Towing ($100) | $150 |
| Secondary Services | Catering ($200-500) + Crew car ($75) + Hangar ($400-800) | $200 |
| TOTAL PER VISIT | $2,250-2,400 |
Auxiliary services have 60% attach rate, Secondary services have 40% attach rate
See how many aircraft fit in your hangar
AirPlx calculates optimized 3D stacking layouts for your exact hangar dimensions.
Run a free layout simulationScale That Out
One additional mid-size jet per week:
- Weekly revenue: $2,400
- Monthly revenue: $10,400
- Annual revenue: $124,800
Understanding 3D aircraft stacking optimization helps you accommodate more aircraft. Calculate your specific ROI on capacity improvements.
But here's where it gets interesting. That's assuming just mid-size jets. Let's look at the full spectrum:
| Aircraft Category | Example Models | Per Visit | Annual (1/week) |
|---|---|---|---|
| Light Jet | Citation Mustang, Phenom 100 | $1,200-1,400 | $72,800 |
| Mid-Size | Citation CJ3, Learjet 45 | $2,250-2,400 | $124,800 |
| Super-Mid | Citation Latitude, G280 | $3,800-4,200 | $218,400 |
| Large Cabin | Gulfstream G650, Global 7500 | $8,500-12,000 | $624,000 |
Note: These are thought-exercise numbers. You won't get the same aircraft type every week, and actual frequency varies by location and season. The point is to understand the revenue value of each additional aircraft you can accommodate.
 Every aircraft represents a revenue opportunity - the question is whether you have the space to accommodate it
The Real Cost of "We're Full"
Most FBOs turn away 5-8 aircraft per month due to capacity constraints. Let's be conservative and say you're turning away 6 mid-size jets per month:
- Monthly lost revenue: $14,400
- Annual lost revenue: $172,800
If even 2 of those 6 are actually super-mids or large cabin aircraft, that number jumps to $250,000+ annually.
Breaking Down the Missed Opportunity
Here's what FBOs miss when they can't accommodate aircraft:
Immediate Revenue Loss
- Fuel sales: Drives total FBO revenue
- Service fees: Direct revenue with minimal variable costs
- Auxiliary services: High-margin add-ons (lav, water, GPU)
Long-Term Revenue Loss
- Customer acquisition: That transient customer could become based
- Network effects: Satisfied customers refer other operators
- Peak period pricing: High-demand periods command premium rates
Hidden Costs
- Competitive disadvantage: They're calling your competitor next
- Reputation impact: Word spreads about which FBOs have capacity
- Market share: Consistent "we're full" responses drive business elsewhere
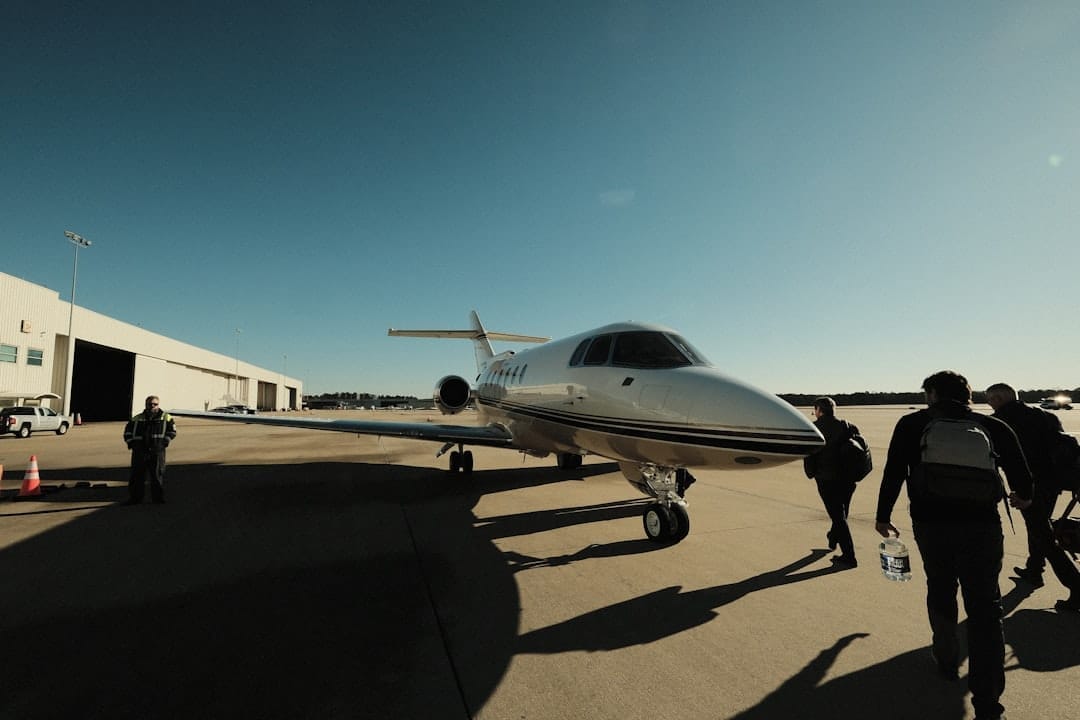 Each additional aircraft represents multiple revenue streams beyond just fuel
The Math on Better Space Utilization
Here's the simple math:
Scenario: Mid-size FBO, 40,000 sq ft hangar
Current state:
- Fitting 12 aircraft per cycle
- Turning away 6 aircraft/month due to poor space utilization
- Lost revenue: $14,400/month = $172,800/year
With optimized stacking (25% capacity improvement):
- Fitting 15 aircraft per cycle
- Accommodating those 6 additional aircraft/month
- New revenue: $172,800/year
Even at 15-20% capacity improvement, you're looking at $100K+ in annual revenue that's currently walking away.
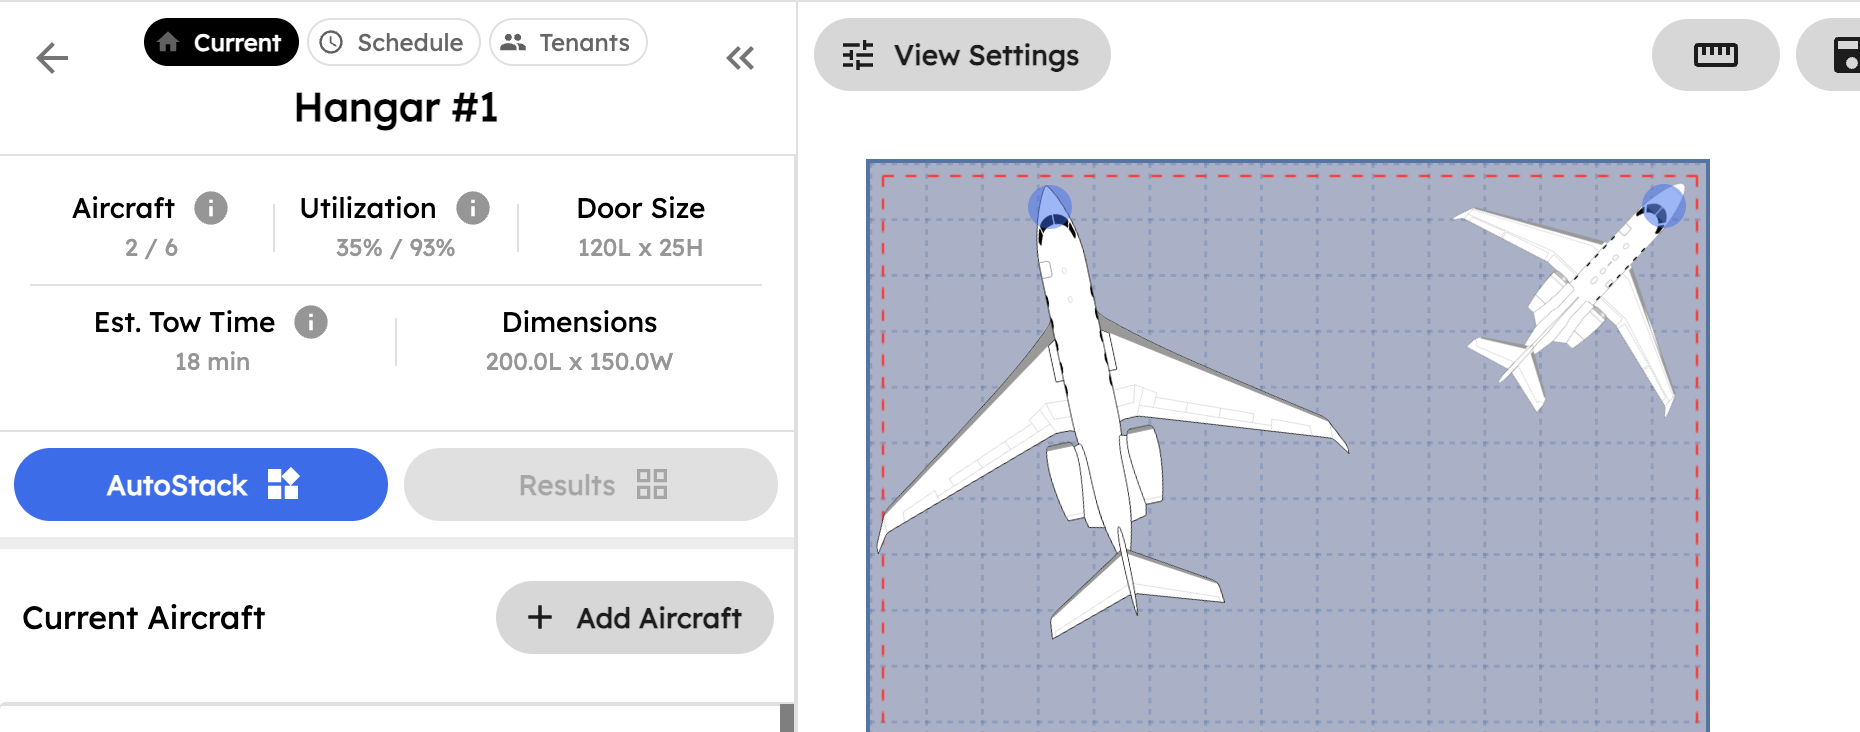 AirPlx shows real-time capacity utilization and revenue impact of stacking decisions
The question isn't the cost of optimization—it's whether you can afford to keep leaving six figures on the table every year.
What Capacity Improvements Actually Look Like
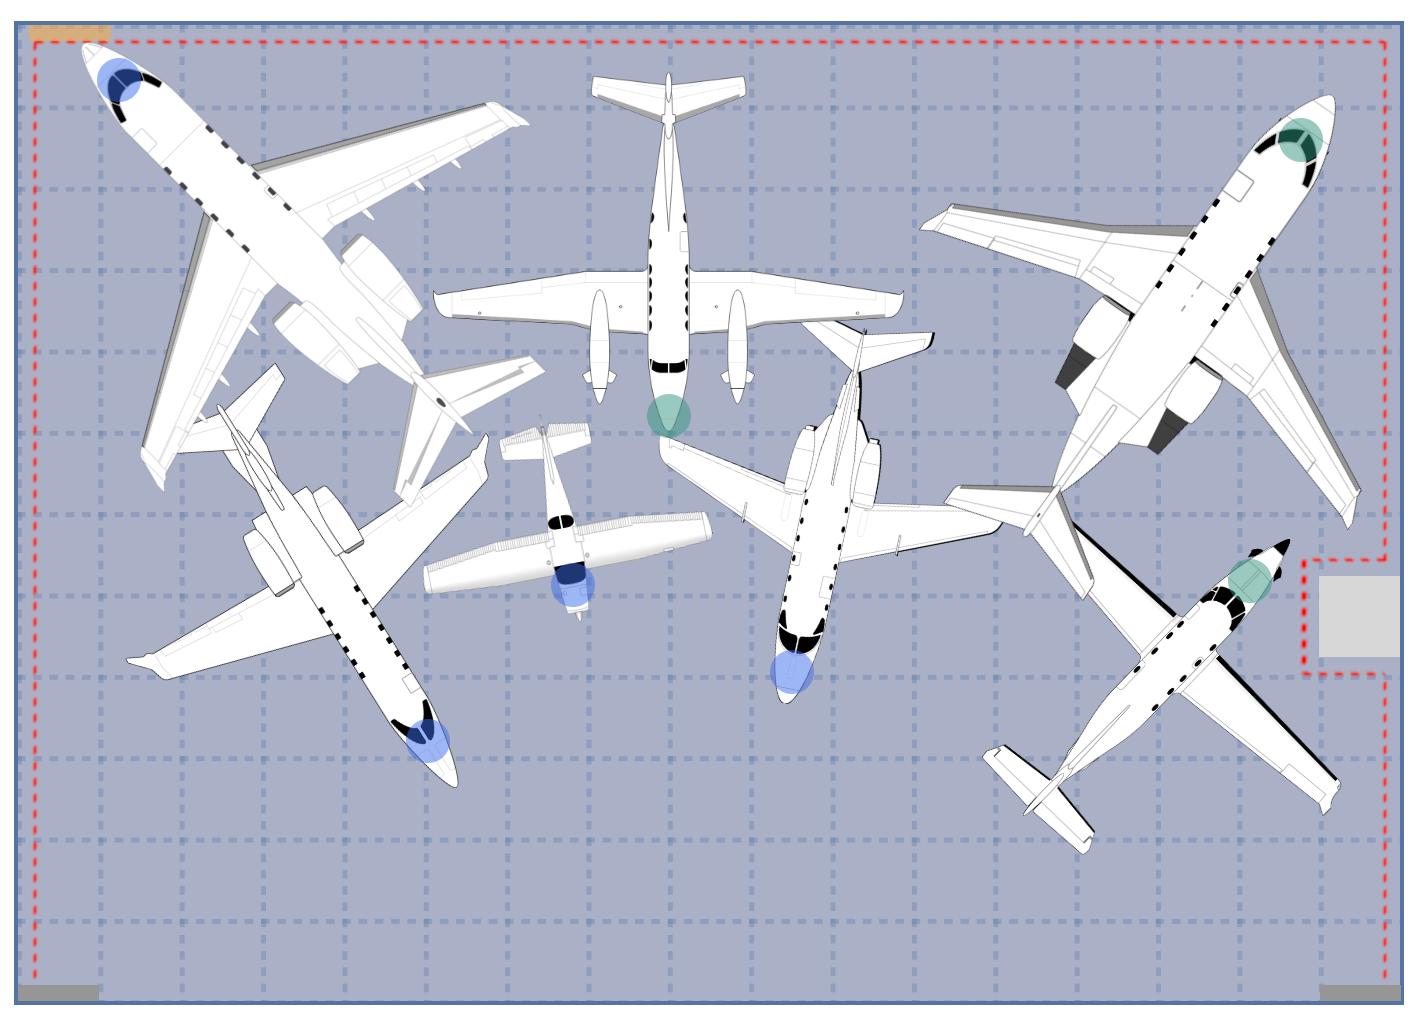 AirPlx lets you simulate tight stacks and test capacity scenarios before moving any aircraft
Different facility sizes see different returns, but the pattern holds:
Smaller operations (30,000 sq ft)
- Typical improvement: 3 additional aircraft
- Conservative annual value: $150K-180K
Mid-size operations (40,000-50,000 sq ft)
- Typical improvement: 4-5 additional aircraft
- Conservative annual value: $200K-350K
Larger operations (60,000+ sq ft)
- Typical improvement: 6-8 additional aircraft
- Mix skews toward larger aircraft
- Conservative annual value: $400K-600K
These are based on industry-standard fuel margins, typical service attach rates, and conservative utilization improvements of 25-35%.
 Optimized hangar stacking can increase capacity 25-45% without physical expansion
The Bottom Line
Every time you say "we're full" when you could have fit one more aircraft, you're leaving $2,000-12,000 on the table. Multiply that across a month, a quarter, a year—and you're looking at six figures in lost revenue.
The question isn't whether you can afford optimization software.
The question is whether you can afford to keep turning away revenue.
One more jet per week = $124,800/year in additional revenue
Even if you can only accommodate 2-3 additional aircraft per month through better stacking, that's $58K-86K in annual revenue you're currently turning away.
The real question: how long can you afford to leave that money on the table?
Sources:
- North America Fixed-base Operators Market - Verified Market Research
- 2024 FBO Fuel Sales Stagnant - NATA Aviation Business Journal
- Aircraft Growth Outpacing FBO Infrastructure Limits - Aviation International News